 Audio Transcription
 Datasets and Services for Training LLM
 Image Annotation
 Video Annotation
 Text Annotation
 Lidar Annotation
 Crowdsourcing
 MedTech Companies
 Banking and Finance Industry
 Biometric Data
 E-commerce and Retail
 Surveys and UX-Researches
 Agriculture
 Retail
 Robotics
 Augmented Reality
 Finance
 E-Commerce
 Face Recognition System
 Ore Annotation
 Content Moderation on the Video
 IBeta 2
 Data Collection for Face and Speech Recognition
 Content Moderation
 Video Systems and Video Analysis
 Content Moderation in Recruitment Domain
 Audio Labeling for Call Center
 Data collection and video annotation: weapon detection on the streets
 Image Annotation for Emotion Recognition
 Data Сollection for Сity Administration
 Liveness Detection
 Annotation Photos for the Recognition System
 Blog
Blog Stages of Work
 Become a Partner
 Student Program
 FAQ
FAQMarkup cases in CVAT #1: find the differences
With this first article I’m starting a series of case studies that I and my colleagues have encountered while using markup data in CVAT.
«Computer Vision Annotation Tool (CVAT) is an open-source tool for markup of digital images and videos. Its main goal is to provide the user with a convenient and efficient means of marking up data sets.» — a quote from the creators’ article.
We all know the children’s game for attention and observation — looking for differences in pictures. We met it in magazines, on calendars and later on websites and VK memes. But who would have thought that this kind of fun reaches the markup of data for training neural networks?
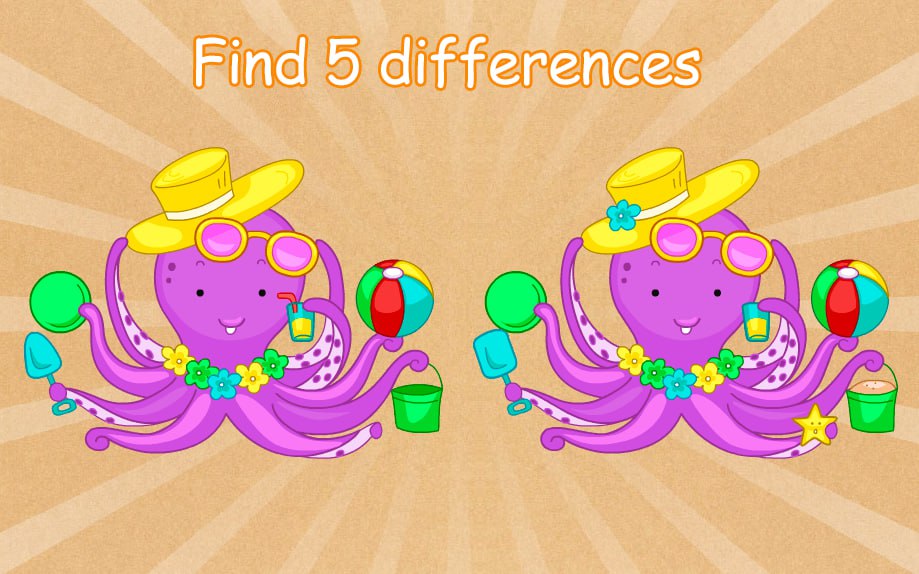
Every day there are more and more requests to markup data for a variety of neural networks, the scope of which is sometimes surprising, funny or shocking. But for what kinds of activities do neural networks need to learn how to find differences? You can find many examples: empties on shelves, forgotten things, motion counter, etc.
I had the task to organize the markup of data from a frame-by-frame survey of rooms where people accidentally or deliberately left items. The markers needed to identify the area of change on the frames with a bbox (rectangle), it was also necessary that the area of change should be fixed on two frames: the frame «before the change», the frame «with the change». This is not the first time I got such bizarre requests from the guys in the neural network development team, so without further ado let’s get to the task.
The CVAT data layout tool doesn’t allow you to show two or more separate images in the same workspace. It only allows you to flip through the images.
So at the stage of loading images into CVAT I encountered the following problem: how to show the marker (the person who will mark up the data) several frames at once?
If we do this task «dully», then we just fill CVAT with all frames in their order, and the marker will need to flip the frames back and forth to identify the differences in them. Then we’ll need to mark up a bbox on one frame and make exactly the same bbox on another. This method will take a very long time, the quality will be questionable, markers will quickly get tired. So we begin to think of optimization.
The easiest solution to the frame flipping problem is to merge adjacent frames into a single image.
Pros: easy and fast programming in Python via PIL; it is convenient for the marker to compare two frames.
Cons: it increases the weight of the images, which increases the waiting time to load the image into CVAT (but you can fix that, too, if you want).
An example of the function glue_together, which «merges» two images into one:
from PIL import Image
import os.path as osp

def glue_together(image1, image2, out_path):
    img1 = Image.open(image1)
    img2 = Image.open(image2)
    width = img1.size[0]*2 #определяем ширину будущего "склеенного" изображения
    height = img1.size[1] #берем высоту первого изображения
    img = Image.new('RGB', (width, height))
    img.paste(img1, (0,0))
    img.paste(img2, (img1.size[0], 0))
    img.save(osp.join(out_path,
                      f'{osp.basename(image1)}__{osp.basename(image2)}'))
The function used two libraries: PIL (pillow) and os. The first allows to process images (I personally prefer this library to OpenCV), the second in this case is aimed at helping to write the path to the file.
Note that in my case all the images had the same width and height, so I didn’t have to worry about fitting files of different sizes to each other.
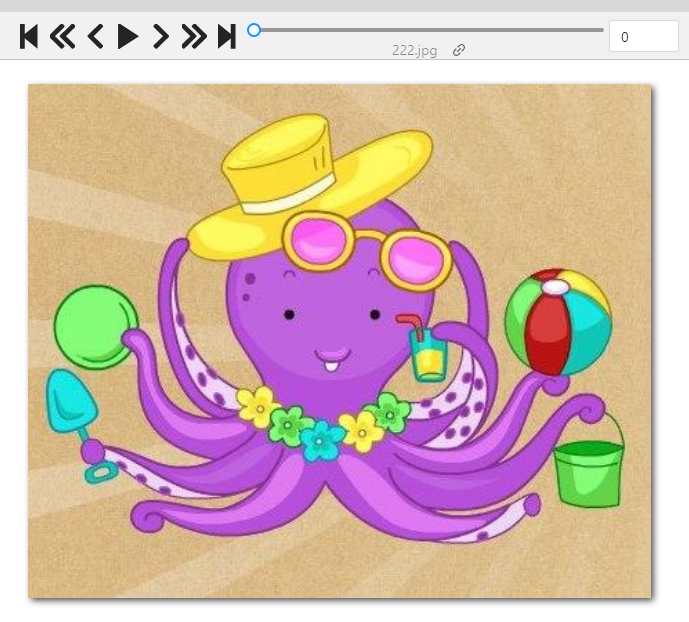
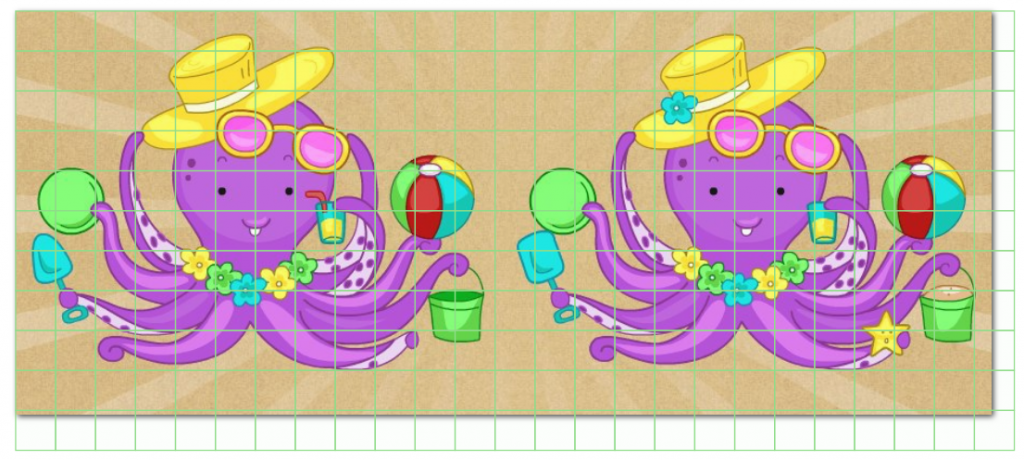
For the example, I cropped two octopuses:


And, using the glue_together function, I merged it together:

Great! Now it will be easier for the marker to navigate among the frames. However, new questions arise before the markup begins:
- How do I know exactly where one frame ends and another begins?
- Highlighting the same areas by eye on two frames is quite complicated and will take a long time, can we speed it up somehow? Can we simplify it somehow?
The questions are really valid and solving them will lead to faster and better markup. If you don’t solve them, the marker will have to:
a) memorize the parameters of the first bbox to make exactly the same second one;
b) always use the CVAT «aim», which will help you determine the upper and lower boundaries of the bbox;
c) try to hit the same point in the upper left corner of the first bbox when creating the second bbox, because the «aim» doesn’t help to determine the right and left boundaries, so you have to work by eye.
The first thing that comes to mind is to make a grid over the image. The idea is good enough, and it will even solve all the above-mentioned problems. But I’ve been told a cooler option: don’t just draw a grid on top of the original image, but create the grid as a markup in CVAT itself, so the markup artists only have to change the bbox classes without wasting time on creating them.
Great, cool, awesome! But… how to implement this?
Here’s a step by step guide:
Since we already put the files into CVAT, we created a task and generated an xml file with markup. In order to download it you have to go to the task page, in the upper right corner click on Actions, select Export task dataset, in the list Export format select CVAT for images 1.1 and click OK. You will download an archive, which contains an xml file with the markup. Let’s open it.
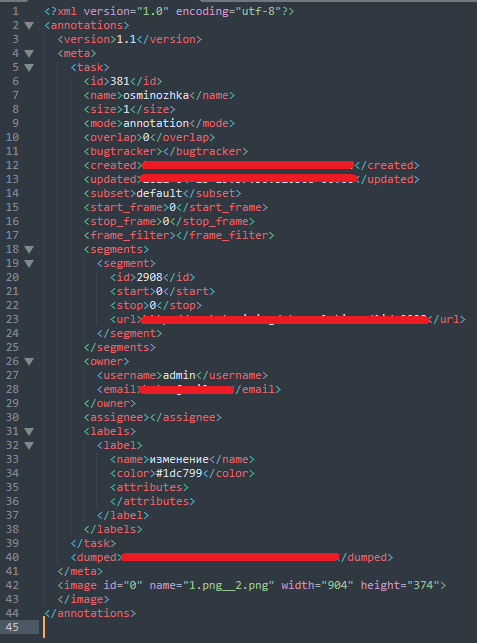
The tag <meta>, which describes all information about the task, is not needed, we will not work with it. Our attention is attracted to the tag <image>. It should contain information about the markup of a particular image. Let’s create a random bbox on the picture and see how the file will change.
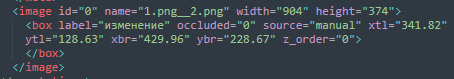
Example of information about one bbox in the image
Under the <meta> tag appears the <box> tag. In it we see the name of the class (label) and the coordinates of the bbox: xtl (x top left) — top left point on x, ytl (y top left) — top left point on y, xbr (x bottom right) — bottom right point on x, ybr (y bottom right) — bottom right point on y.
To work with xml, we’ll use the ElementTree library:
import xml.etree.ElementTree as ET
from tqdm import tqdm
import os.path as osp

def make_patches(w, h, numb_lines=10): #создание списка координат bbox'a
    step = int(h / numb_lines)
    coords = []

    for x in range(0, w, step):
        for y in range(0, h, step):
            x1, y1, x2, y2 = x, y, x + step, y + step
            coords.append((x1, y1, x2, y2))
    return coords


def pre_annotation(empty_annotation, pre_annotation):
		#создание нового файла разметки
    tree = ET.parse(empty_annotation)
    root = tree.getroot()
    for child in tqdm(root):
        if child.tag not in {'version', 'meta'}:
            image_coords = make_patches(int(child.attrib['width']),
                                        int(child.attrib['height']), 10)

            for coord in image_coords:
                bbox = ET.Element('box', label="без изменений", occluded="0",
                                  source="pre_annotated",
                                  xtl=str(coord[0]),  ytl=str(coord[1]),
                                  xbr=str(coord[2]),
                                  ybr=str(coord[3]),z_order="0")
                child.append(bbox)

    xml_str = ET.tostring(root, encoding='utf-8', method='xml')

    with open(osp.join(pre_annotation,'pre_annotation.xml'), 'wb') as xmlfile:
        xmlfile.write(xml_str)
        xmlfile.close()
In order to load our pre-markup file pre_annotation.xml, you need to go back to the task page, in the upper right corner click on Actions, select Upload annotations, in the drop-down list select CVAT 1.1 and specify the path to the file pre_annotation.xml.
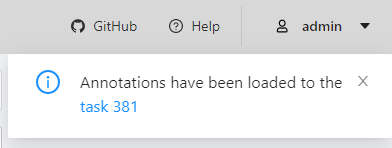
The pre-markup will be uploaded to the task and CVAT will tell you about it:
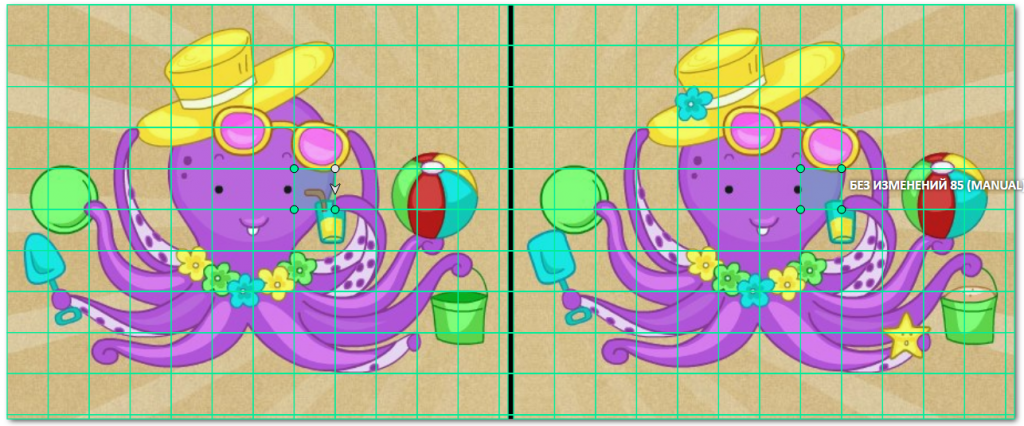
Let’s open the image and see what happens:
As we can see, the grid is overlaid successfully. However, it is not oriented on the fact that our image consists of two frames, and we need each bbox for each frame to have the same coordinates when we process the markup result. In this example, the coordinates of the upper-left bbox of the left frame are NOT equal to the coordinates of the upper-left bbox of the right frame. To do this, do not even need to go into xml and compute the markup for each frame separately, it is immediately visible as the bboxes moved over the right border of the glued image.
This defect must be corrected. And also a new idea: to make it so that when you select one box, the second duplicate box from the other frame will automatically change. I have seen two solutions to this issue:
1. create a grid where bboxes are linked;
2. solve this issue when processing the partitioning file.
The first option seemed the most interesting, because I had no idea how to do it. But solving a problem sooner or later pops into my head, and that’s what I decided to do:
Create an 8-point polygon

The following code was written for this purpose:
import xml.etree.ElementTree as ET
from tqdm import tqdm
import os.path as osp
from PIL import Image

def new_glue_together(image1, image2, out_path):
  img1 = Image.open(image1)
  img2 = Image.open(image2)
  width = img1.size[0]*2+int(img1.size[0]/80)
  height = img1.size[1]

  img = Image.new('RGB', (width, img1.size[1]))
  img.paste(img1, (0,0))
  img.paste(img2, (img1.size[0]+int(img1.size[0]/80), 0))
  img.save(osp.join(out_path, f'{osp.basename(image1)}__{osp.basename(image2)}'))

def new_make_patches(w_start, h_start, ROWS_PER_IMAGE = 10):
    coords = []
    frame_w = w_start//2-int((w_start//2)*0.005964)

    side = h_start//ROWS_PER_IMAGE
    x, y, w, h = (0, 0, side, side)
    while y < h_start:
        x = 0
        while x < frame_w:
            w_ = min(w, frame_w - x)
            h_ = min(h, h_start - y)
            coords.append([
                (x+w_,y),
                (x+w_,y+h_),
                (x,y+h_),
                (x,y),
                (x+w_ + frame_w + int(frame_w/80), y),
                (x+w_ + frame_w + int(frame_w/80), y+h_),
                (x + frame_w + int(frame_w/80), y+h_),
                (x + frame_w + int(frame_w/80), y)
            ])
            x += w
        y += h
    return coords

def pre_annotation(empty_annotation, pre_annotation):

    tree = ET.parse(empty_annotation)
    root = tree.getroot()
    for child in tqdm(root):
        if child.tag not in {'version', 'meta'}:
            image_coords = new_make_patches(int(child.attrib['width']),
                                            int(child.attrib['height']), 10)

            for coord in image_coords:
                str_coords = ""
                for c in coord:
                    if c != coord[-1]:
                        str_coords += str(c[0])+', '+str(c[1])+'; '
                    else:
                        str_coords += str(c[0])+', '+str(c[1])
                bbox = ET.Element('polygon', label="без изменений", occluded="0",
                                  source="pre_annotated", points=str_coords,
                                  z_order="0")
                child.append(bbox)

    xml_str = ET.tostring(root, encoding='utf-8', method='xml')

    with open(osp.join(pre_annotation,'pre_annotation.xml'), 'wb') as xmlfile:
        xmlfile.write(xml_str)
        xmlfile.close()
What has changed:
1. the glue_together function was rewritten:
a) added creation of a «partition» between images, imho it is easier to understand where one frame ends and another begins
2. the make_patches function has been rewritten:
a) the list of coordinates is collected for a polygon, not a box
b) the added «partition» between the frames is taken into account
3. the pre_annotation function has been rewritten:
a) it is now sharpened to add polygons, not bboxes
Result:
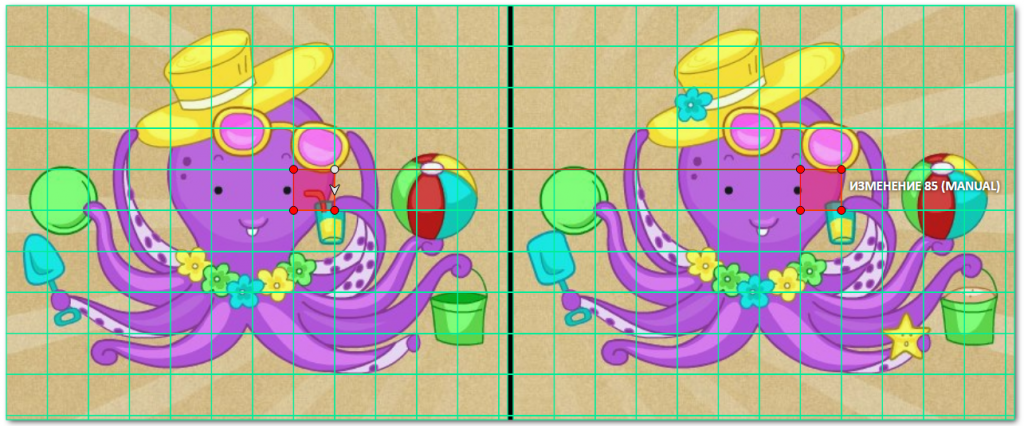
Voilà! The boring data markup has turned into a puzzle game.
Now we can summarize.
By visualizing 2 frames in one image and creating a grid-based pre-markup, we were able to achieve:
- creating a comfortable markup process for the markers;
- increase the quality of markup;
- increase the speed of markup;
- to prevent the rapid fatigue of the markers.
Thus, we fulfilled the request of the developers, who wanted the change area to be locked into two frames. Of course, in order to create a satisfying markup file, we need to write another script that converts the xml file from CVAT into a form understandable to developers. It’s worth noting that this places an even greater burden on the person who handles technical support for the markup projects (in this case, the burden falls on me). But in such tasks, the emphasis is always on optimizing the time of the markers, because the process of manual markup is almost always longer than the process of writing an additional script.
